Measuring design system efficiency: Key metrics for demonstrating financial impact
13 May 2024
Does all the effort your organization puts into design systems really pay off? Choosing the right metrics to measure whether a design system is worth the investment is not always easy. The key is to select the ones that fit your organization’s goals and business objectives. Let’s look at the ones that can be valuable to you.
If you are reading this article, you have probably decided to introduce a design system in your company. If you want to learn more about a design system and its benefits, take a look at this landing page or read a case study about a design system we designed for Wirtualna Polska.
Here, we will focus on measuring the impact of the design system in terms of UX, UI, team efficiency and – more generally – the impact of change on an entire organization. Although there are many articles online about measuring design system efficiency, most of them focus only on design teams and not on the holistic business perspective. We will inspect how to measure the DS efficiency in terms of ROI and financial impact on the entire organization.
Before you start
Before diving into the metrics, it's highly advisable to define your KPIs and outline what you need to measure within your design system (and why). You can start by clarifying your ambitions and objectives. What specific goals do you want to achieve, or what problems do you want to solve with this design system? Are you primarily looking to increase efficiency, encourage collaboration, ensure consistency or fulfil other specific needs?
Here, you will find a detailed list of 10 questions worth asking at your first meeting.
Also, consider the scale of your analysis. How many projects or components will you evaluate within the design system? Once you know the scope of your assessment, you can tailor your metrics to the appropriate level of granularity.
Another aspect is the involvement of the various stakeholders. How many designers, developers or product teams are actively involved in the design system? Answering these questions will allow you to establish a clear roadmap for selecting metrics that match your objectives and reflect the dynamics of your ecosystem.
Quantitative metrics
Basic quantitative metrics serve as fundamental indicators in determining the effectiveness of a design system and provide insight into its impact on the overall organization, user research and business value propositions. Crucially, these metrics provide a reference point that compares the current design methodology and the transformative potential of implementing a design system.
Average time to task completion
Comparing the average time it takes to complete a task with and without a design system provides a tangible measure of the increase in efficiency. By quantifying the time saved using design system resources such as prefabricated components and standardized processes, you can evaluate the system's impact on workflow optimization.
Cost savings per project Calculating the cost savings per project by estimating the hourly rate of designers and the time invested in project deliverables provides a direct assessment of the financial benefits enabled by the design system. This metric illustrates how the system streamlines design processes and reduces labor hours and associated costs.
Number of designers utilizing the design system:
The scale of adoption, reflected in the number of designers actively engaging with the design system, is a compelling indicator of its utility and effectiveness. A higher number of users signifies widespread acceptance and integration of the system into daily workflows, reinforcing its value proposition.
Monthly design effort:
Tracking the hours designers spend designing new components per month provides insights into the evolution and sustainability of the design system. This metric may indicate a high activity level as new components are developed and integrated. Over time, a decrease in design effort may suggest optimising and refining the existing component library rather than declining system usage.
Monthly cost savings
Estimating the savings from utilising the design system offers a comprehensive view of its financial impact. By quantifying the reduction in design hours and associated expenses, organizations can gauge the return on investment and justify continued investment in system development and maintenance.
Operational aspects of DesignOps
This includes analyzing the volume and speed of component requests, the efficiency of request processing, and the frequency of successful component deliveries. Understanding these operational dynamics provides valuable insights into the responsiveness and effectiveness of the design system in meeting evolving organizational needs.
How to efficiently measure DS adoption?
In most online resources, you can find “adoption” as the key indicator of the design system's success in the organization. However, there is some controversy in measuring this adoption – in both code and design.
The primary metrics here are:
- tracking the number of times a component is used;
- the frequency of components and patterns in the codebase;
- the percentage of code that follows the guidelines.
However, a high number of components used does not necessarily indicate a well-designed system. Some experts recommend measuring the number of products that have implemented a particular component at least once in their codebase. This way, it can be determined which components are used and which are not, which products use the components of the design system intensively and which use them only minimally or not at all.
Another alternative could be to track where the components are used. Instead of tracking how often a component is used, you can track the number of pages where the component of a design system has been used at least once. This will tell you which components are used most frequently and for which pages.
Other important adoption metrics include:
- Number of "detach" components from the design system (done when you want to create a new component based on the old one).
- Measuring what version of a component is implemented in different places. This is important when your design system is used by different products and platforms, and its goal is to see whether product X uses the old or the new component.
- Coverage of view architecture by components from the design system. This shows how many items in a given view come from the design system and how many are one-offs.
Other metrics
- Team efficiency. Measure how long it takes teams to build a new product using the organization’s design system.
- Speed to market. Measure how long it takes teams to build and test prototypes.
- Effect on code. Measure how much code developers change with each release.
Qualitative metrics
While quantitative metrics provide valuable insights into the tangible impact of a design system, qualitative data offers a deeper understanding of its softer but equally important aspects such as collaboration efficiency and user satisfaction.
Collaboration efficiency and cross-team communication. Qualitative measurements can show how much the design system improves cross-team collaboration and communication. Surveys and interviews can effectively capture user feedback across different teams and disciplines. By gaining insight into the dynamics of collaboration, organisations can evaluate indicators such as reduced dependencies, streamlined workflows and improved communication practises facilitated by the design system.
Sample questions:
- How frequently do you utilize the design system in your work?
- What improvements or enhancements would you like to see implemented in the current design system?
- How effectively does the design system enhance your workflow on a scale of 1 (strongly disagree) to 5 (strongly agree)?
- Have you observed specific instances where the Design System has facilitated smoother collaboration or communication between teams?
By using qualitative data collection methods and asking targeted questions, companies can gain differentiated insights into the user experience and the dynamics of collaboration around the design system. These qualitative insights complement the quantitative measurement data, providing a holistic view of the system's impact and enabling iterative improvements based on user feedback and preferences.
Is there a formula to measure the design system's impact on ROI?
Determining a design system's return on investment (ROI) involves evaluating the tangible benefits compared to the costs of implementation and maintenance. Key metrics for evaluating the ROI of design systems include gains over time from the design system you build plus building and maintenance costs.
In 2022, Smashing Magazine presented a formula for calculating the ROI effect of design systems. This formula compares the costs associated with creating and maintaining products without a design system to the benefits and gains that result from implementing a system.
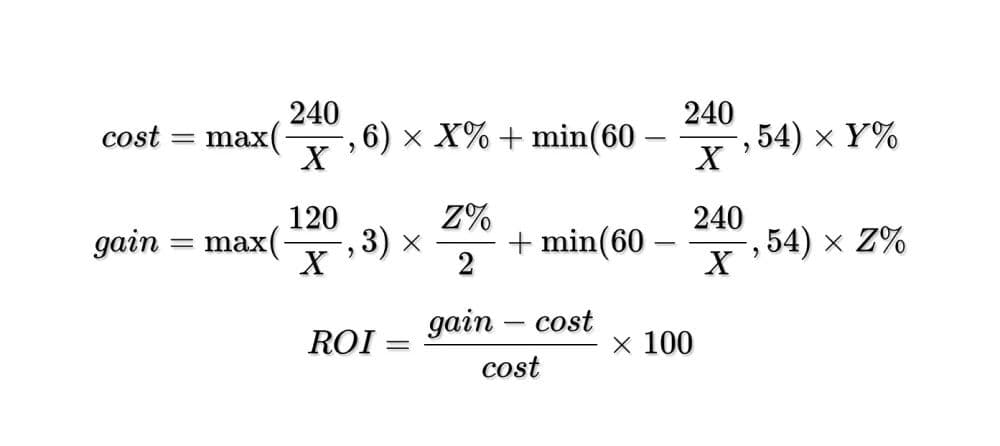
Source: Smashing Magazine
X = percentage of time invested in building the design system.
Y = percentage of time spent on ongoing maintenance after the start-up phase. The ramp-up phase refers to the initial effort required to bring a project to a point where it can smoothly transition into maintenance mode.
Z = time saved using the design system as a percentage – productivity or efficiency gains.
Once you have calculated the “cost” and “profit" components, you can plug them into the ROI formula to calculate the ROI.
Existing studies on the productivity of design systems show that design teams increased their project efficiency by an average of 38%, while development teams saw an average increase of 31%.
Useful resources
If you are interested in more design system resources, look at this guide or contact us directly. You can also take a look at this article on why you should invest in a design system. We recommend following us on LinkedIn for further information!
If you want to contribute to our ongoing research on Polish design systems, please complete this survey—it will help us learn more about the DS landscape in Poland!